The following data about drug use by Age Group is taken from a 2012 National Survey on Drug Use and Health:
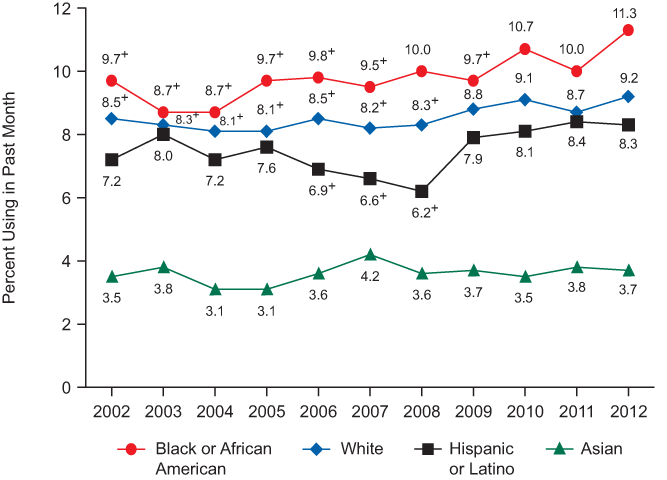
The image above shows “Past Month Illicit Drug Use among Persons Aged 12 or Older, by Race/Ethnicity: 2002 through 2012.” The survey years are shown on the X axis and the percentage using in the past month is shown on the Y axis.
The following used drugs in the past month:
- 3.7% of Asians
- 7.8% of Native Hawaiians or Other Pacific Islanders
- 8.3% of Hispanics
- 9.2% of Whites
- 11.3% of Blacks
- 12.7% of American Indians or Alaska Natives
- 14.8% of persons of two or more races.
Illicit Drug Use by Race
- Among Blacks or African Americans, illicit drug use was 9.7% in 2002, 8.7 % in both 2003 and 2004, 9.7% in 2005, 9.8% in 2006, 9.5% in 2007, 10% in 2008, 9.7% in 2009, 10.7% in 2010, 10% in 2011, and 11.3% in 2012
- Among Whites, illicit drug use was 8.5% in 2002, 8.3% in 2003, 8.1% in both 2004 and 2005, 8.5% in 2006, 8.2 percent in 2007, 8.3% in 2008, 8.8% in 2009, 9.1% in 2010, 8.7% in 2011, and 9.2% in 2012
- Among Hispanics or Latinos, illicit drug use was 7.2% in 2002, 8% in 2003, 7.2% in 2004, 7.6% in 2005, 6.9% in 2006, 6.6% in 2007, 6.2% in 2008, 7.9% in 2009, 8.1% in 2010, 8.4% in 2011, and 8.3% in 2012
- Among Asians, illicit drug use was 3.5% in 2002, 3.8% in 2003, 3.1% in both 2004 and 2005, 3.6% in 2006, 4.2% in 2007, 3.6% in 2008, 3.7% in 2009, 3.5% in 2010, 3.8% in 2011, and 3.7% in 2012.


